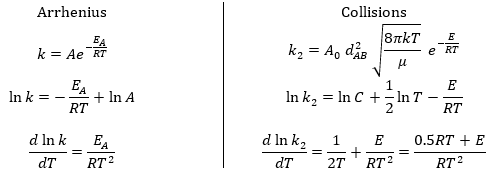
The following theories only apply to elementary reactions, i.e. in reactions in one step. The empirical relation of Arrhenius can be used (this relation is not limited to the elementary reactions):
with kexp the kinetic constant found experimentally, Aexp the pre-exponential factor (same dimensions as kexp) and Ea the energy of activation. The goal is to measure experimentally Aexp and Ea. To do so, there are two theories in kinetics:
- the theory of the collisions and
- the theory of the state of transition.
Theory of collisions for bimolecular reactions (by W.C.Mc C.Lewis)
The principle is that all the collisions between molecules don’t lead to a reaction. There is a minimum of energy required to proceed. The speed of reaction can be characterised by
The speed of the molecules is not identical for each species. There is a distribution of speed, expressed by the distribution of Maxwell-Boltzman:
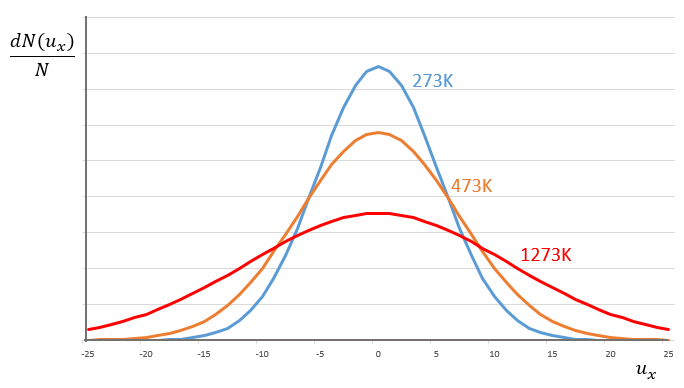
This expression gives the proportion of particles with the speed ux in the direction x. It gives a Gaussian centred at ux=0 because the particles can go in both directions of the axis. The surface under the Gaussian is constant but the curve becomes flatter if the temperature increases.
This change implies that more speeds are accessible to the particles if the temperature rises.
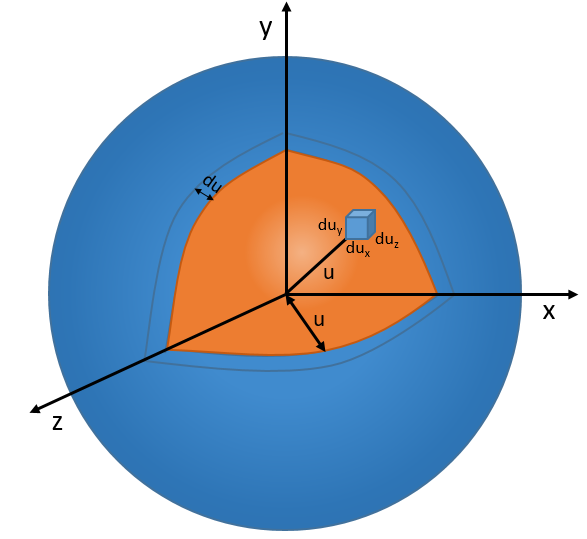
In 3 dimensions, the equation becomes
Now, instead of dux, duy and duz that apply to one direction of speed only, we want to get an element of volume in the phase of speed in all the directions. In the phase of speeds, it corresponds to a coquille of a sphere with a thickness du. The volume of the coquille is 4πu2du.
The equation of MB becomes
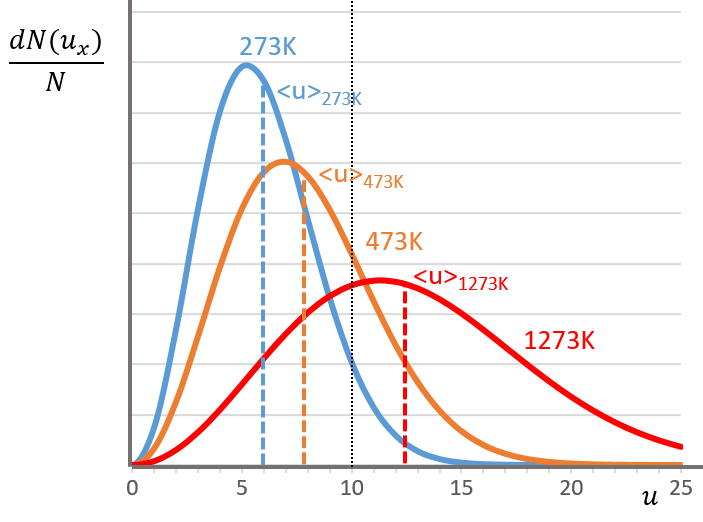
The consequence of the factor 4πu2 is that the curve is not a Gaussian anymore but a parabola and goes from u=0 to u= ∞ (the curve is symmetric for positive and negative values of u anyway).
The maximum of the parabola is not at u=0 but it gives the most probable speed. Note that the most probable speed is not equal to the average speed <u>. Indeed, more than the half of the particles have a speed larger than the most probable speed. It is more and more displaced with larger temperatures.
The maximum of the curve can be found for

There is however a problem with this distribution of speed: if we strictly follow this distribution, the average speed of a gas such as N2 is approximatively 400ms-1, i.e. faster than the speed of the sound. If it was real, then when we open a bottle of a smelling volatile product (pyridine for example) at one side of the lab, we should instantly smell the odour of pyridine at the other side of the lab. It is not the case because we neglected the presence of other particles in the air. The collisions between the particles of the sample and the particles in the air reduce the spreading of the gas.
Model of collisions
There are two conditions for a reaction A + B à products to take place:
- there must be a collision between the reactants and
- the reactants must have an energy large enough to react.
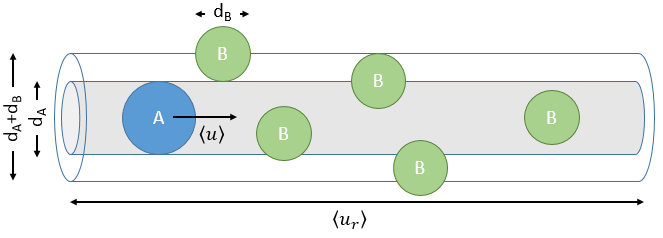
The model relates the behaviour of one particle of A that moves straight forwards with an average speed <ur> through a static cloud of particles B without speed.
A and B are considered as solid spheres with a diameter dA and dB. The condition for a collision to take place in a period of time dt is that the centres of the spheres B are in the cylinder of length <ur>dt in the direction of propagation of A and diameter dA+dB centred on the A. The number of collision for one particle A by unit of time is given by
with NB the amount of particles B by unit of volume and rAB=dA+dB/2 the radius of the cylinder. There are several particles A moving simultaneously. The amount of collision is
There is one more thing that we have to consider: the particles B are also moving freely. Instead of the speed of the particle A, we will consider the relative speed of A with regards to B. Moreover, the angle of approach of the collision can vary. If we consider the collision between two identical particles, the collision can occur between two particles moving on the same line in opposite directions (angle=0°) with a speed <ur>=2<u>, between two particles moving almost alongside (angle ~180°) with a speed <ur>=0 or with angles between 0 and 180°.
The average angle of collision is thus 90°. Considering this angle, the average speed for the collision between two identical particles is
and for two different particles
The speed of a particle is given by the distribution of Boltzmann:
Inserting this expression in the previous one, we obtain
The amount of collisions by unit of time and volume is thus
Note that if we count the amount of collisions between identical particles, we have to divide ZAA by 2 because otherwise we count each collision twice.
Now that we know the amount of collisions, we have to consider the fact that only a fraction F of them lead to a reaction between the particles. The particles must have an energy ε large enough to react and form products (ε > εmin). As for the speed, there is a distribution of kinetic energy f(ε) that gives the fraction of particles with an energy between ε and ε +dε.
The distribution of energy depends on the temperature and also decreases if ε gets larger. The fraction of effective collisions contains all the collisions with molecules with an energy larger than ε, not limited to ε+dε.
Macroscopically, the equation is
where A0 is the number of Avogadro. The speed of reaction is given by the frequency of collision multiplied by the fraction of effective collisions.

We define
We know that we can write the speed of a reaction of order 2 as
The relation between the two expressions is thus that
and for collisions between identical particles
Comparison between the results of the theory of collision with the empiric law of Arrhenius
From this comparison we find that the experimental energy of activation EA is given by the energy required to have an effective collision plus ½ RT. If E>>>RT, then the energy of activation that is determined experimentally (i.e. from Arrhenius) is approximatively equal to E. As a result,
This match between the experimental observations and the theoretical values is only good for simple molecules. In the theory of collisions, we considered the particles as hard spheres. Otherwise, we introduce the factor of steric hindrance, or the factor of probability, p
Theory of the state of transition
This approach is more elaborated and can be applied to more complex molecules and to other phases than gases. This method takes the rotation and vibration into account.
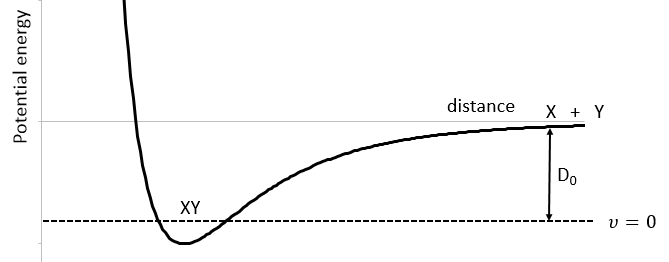
We know that there is a potential energy that is characteristic of a liaison. Starting from the vibrational level μ=0, i.e. the state where there is the highest probability to find the molecule, we need to give some energy to the liaison to break it and obtain a fragment X and Y.
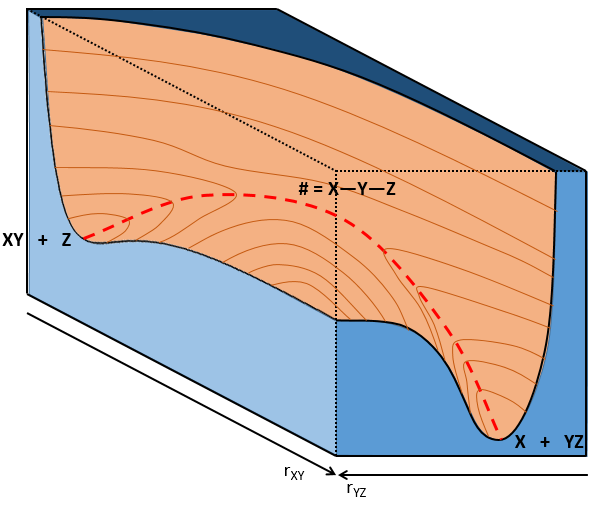
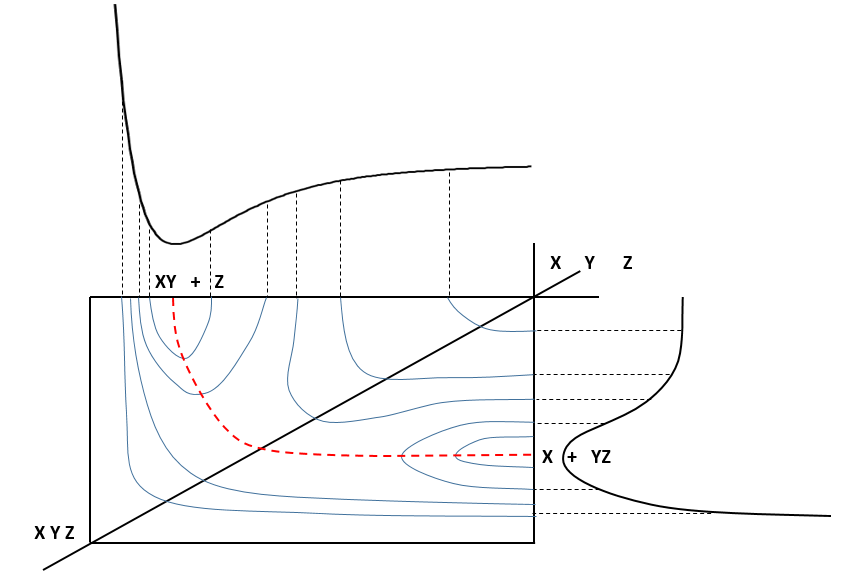
If a third molecule comes into play and is aligned with a diatomic molecule, there can be a collision introducing the third atom in the molecule and ejecting the atom at the opposite of the collision. To represent this phenomenon, we add one dimension to the figure above, leading to a surface of potential energy.
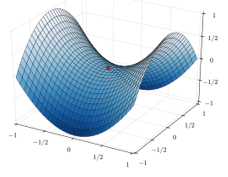
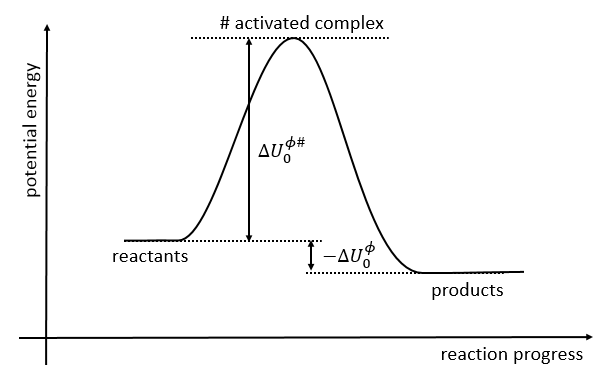
The path requiring the minimum energy is plotted in red and is called the reaction path and is the most probable path. Between the XY + Z and the X + YZ states, there is a state of transition # in which the liaison between Y and Z is not completely made and between X and Y not totally broken. The liaisons are extended and require more energy. Indeed, this state, called a complex of transition, is higher in energy than the state XY + Z and X + YZ. It is a saddle point in the space of reaction: a maximum in a direction and a minimum in another direction.
When the reaction reaches the transition state, the reaction can either go ahead or go back. The direction the reaction takes depends on the vibration and on the difference of energy between the states the reaction leads to. We can also represent the surface at two dimensions with isocurves of energy (see next figure).
On the top side and on the right side of the graph, we see the potential curves of the liaisons YZ and XY respectively. The dotted line on the graph shows the path of lowest resistance. It is the most probable path of reaction. At the intersection between the axes, all three species are separated by the same, long distance and are not bound together. At the other side of the graph, there is no liaison between the atoms but they are very close to each other. If we plot the line connecting those two corners, the complex of transition is at the minimum of energy on this line.
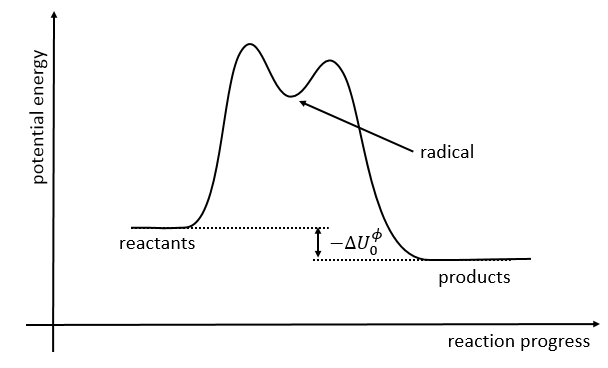
If we plot the potential energy along the reaction path, we will obtain something like this:
The ϕ symbol indicates that we are in normal conditions of temperature and pressure.
The model of the transition state
An equilibrium is considered to exist between the reactants and the complex of transition X#. From the complex of transition, products are formed with a frequency υt.
The speed of formation of the product is given by
Our problem is to determine the concentration of the complex of transition. We find it from the first step of the reaction. If this step is monomolecular (one reactant A), then
If the first step is bimolecular, then
If we replace υt Kc # by km, we find the experimental constant of reaction. To be perfectly correct,
![]()
where κ is the coefficient of transmission that is usually equal to 1.
Statistical formulation of km
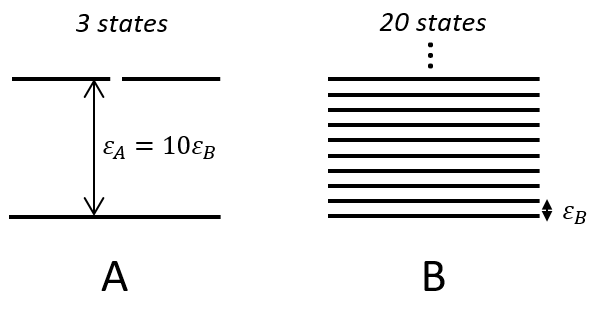
There is a given number Q of states that are accessible to each molecule.
where gi is the degeneration of the state i and εi is the difference of energy between the state i and the ground state. The number of accessible states depends on the temperature.
where ΔU0 is the difference of standard intern energy with regards to the zero point. We can also consider the molar standard intern energy but in this case we have to divide the functions of partition Q0(i) by A0V, A0 being the number of Avogadro.We can link the equilibrium constant of a reaction with the functions of partition of the molecules that take part in the reaction. Let’s consider a reaction
As km=υt Kc#, we can write
with m the order of the reaction. The function of partition of a molecule is related to its vibration, rotation and translation modes. For the complex of transition, the function of partition of the vibration mode can be isolated and is related to the frequency of vibration of the liaisons that are broken and made.
The function of partition is thus approximatively
If the factor of frequency υt = υ#, then we obtain the statistical formulation of the constant of speed
Q0(A) and Q0(B) can be determined by spectroscopy but Q0# has a life time too short to be correctly analysed (the time of a vibration, τ~100 femtoseconds). The functions of partitions depend on the temperature and we can globally write that
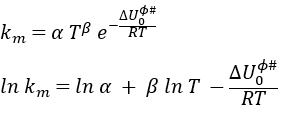
Taking the derivative of this expression with regards to the temperature, we obtain
If we compare this expression to the law of Arrhenius, we have that
β is usually small so EA»ΔU0ϕ#.
Estimation of the pre-exponential factor of the equation of Arrhenius
We will consider the reactants as hard spheres.
In this condition, there is no vibration nor rotation to consider for them. They have thus only 3 freedom degrees. The function of partition of translation is
The transition complex is composed of two hard spheres and can thus rotate in two planes. We will assume that we can write the rotation and translation as two independent functions.
The mass we consider for the transition complex is simply equal to the sum of the mass of the two reactants: mAB#=mA+mB. The function for the rotation is

This expression for k2 is the same than the one obtain by the model of collisions but we obtained it with a totally different approach. As in the model of collisions, the molecules were considered as hard spheres and the model is not correct for more complex structures.
Thermodynamic formulation of km
In a gaseous phase, we have that
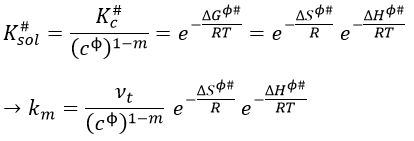
To obtain km in solutions, we have to divide Kc# by a power of the concentration cϕ=1mol/l
We want to connect this expression to the relation of Arrhenius. To do so, we need to make the approximation than υt=kT/h. As a result,
We will assume that ΔHϕ# and ΔSϕ# don’t depend upon T so that we can derivate the expression with regards to the temperature.
The enthalpy ΔHϕ# is related to the intern energy of activation ΔUϕ#. For ideal gases the relation is
Once the derivation d/dT is done, we obtain
Previously in the theory of the transition state, we found EA= ΔU0ϕ#+βRT. Here β=1.
The variation of entropy is thus included in the pre-exponential factor. There is a variation of entropy during the formation of the complex of transition. For unimolecular reactions A → B in gaseous phase, the variation of entropy is approximatively equal to zero as there is no variation in the number of particles.
If the experimental pre-exponential factor is larger than 10-13s-1, it means that there is a variation of entropy during the process and that the reaction is a reaction of dissociation (A → B + C).
The fact that the variation of entropy is present in A is a big advantage with comparison to the model of collision where a steric factor was considered to obtain a result similar to the experimentations.
Femtochemistry
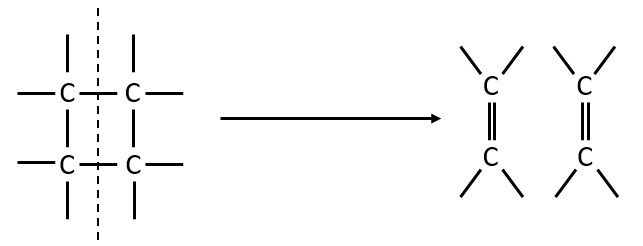
The femtochemistry allows to detect events with a timescale of the femtosecond. A. Zewail (Nobel prize in 1999 for his work on femtochemistry) studied in 1996 the transition states of chemical reaction with femtosecond spectroscopy. Using a rapid ultrafast laser technique (ultrashort laser flashes), the technique allows the description of reactions on very short time scales – short enough to analyse transition states in selected chemical reactions. For instance we can obtain 2 ethylene molecules from one cyclobutane and we want to determine the process. One possibility is the simultaneous cleavage of two liaison during one single vibration.
A second possibility involves the formation of a complex of transition wearing two radicals from the cleavage of one of the liaisons, and then the cleavage of the second liaison to obtain two ethylenes.
The second step of the reaction would be easier than the first step because the radicals help to the cleavage of the other liaison. The correct process is the one involving radicals. The life-time of the complex of transition is about 700fs and can be detected with femtosecond spectroscopy.
Application: photoreduction of the RuTAP by the GMP
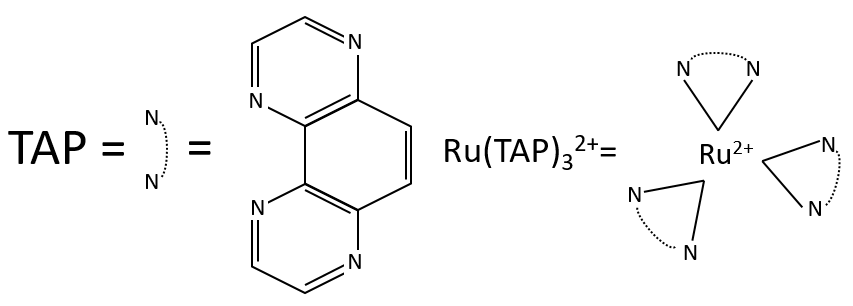
We study here the transfer of one electron between the two species. The Ru(TAP)32+ (TAP= 1, 4, 5, 8-tetraazaphenanthrene) is a complex of coordination that can interact with DNA. We will next call it RuTAP.
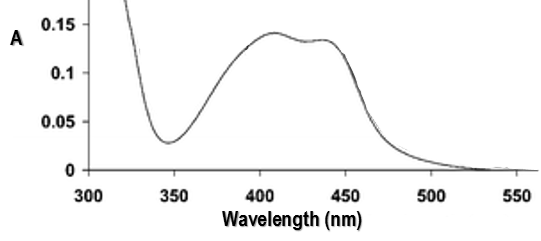
RuTAP absorbs in the visible (max at 420nm, orange-red).
Instead of the analysis of the interaction of RuTAP with DNA, we replace the DNA by GMP (guanosine-5’-monophosphate) in this experiment. If we put RuTAP and GMP together in the dark, nothing happens. To observe a phenomenon, RuTAP has to be in an excited state. We illuminate the system at 420nm to excite RuTAP into RuTAP*.
The excited species will go back to its ground state through two possible reactions:
- the emission of a photon (not the same wavelength than the absorbed photon)
- the transfer of energy to the GMP. It leads to transitory products.
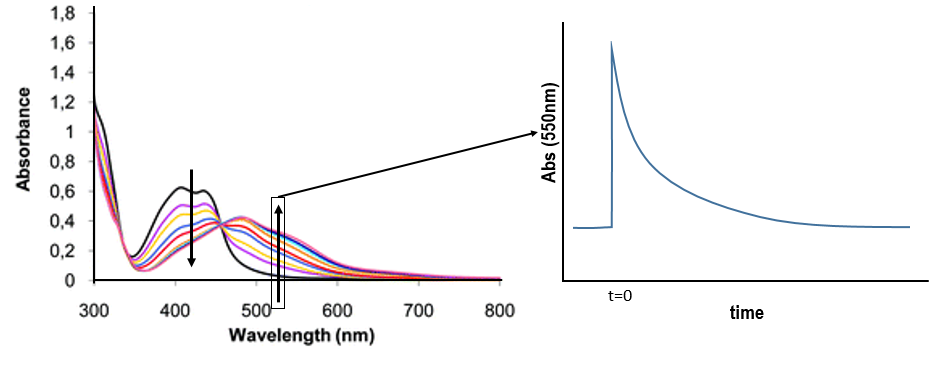
We want to determine the nature of A and B. We place the system in conditions such as the deexcitation through the emission of a photon does not occur. The illumination is only maintained during approximatively 10nanoseconds. However, the transfer of electron is completed over this period of time. After the pulse of light, we can study the evolution of the system through the emission of the solution. We don’t look at the wavelength in the range of the RuTAP (420nm) but in a range of frequencies where it does not emit: at 550nm, we find an intense signal that decreases quickly over time.
Before the pulse, nothing emits at 550nm. The formation of the emitting species is very fast but its decomposition is fast too. After the pulse, the transitory products of the reaction disappear over time and the signal comes back to zero. One hypothesis is that A is the reduced complex and that B is the oxidised GMP, respectively noted A=Ru1+ and B=GMP.+. This hypothesis is verified by a parallel experiment in which we measure the spectrum of Ru1+ alone.
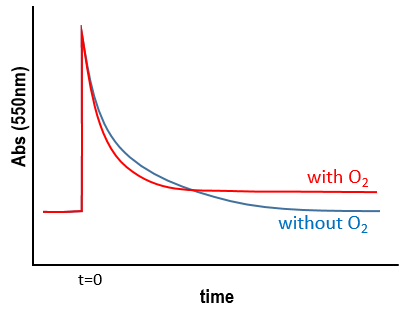
We still meet one problem: the experiment was performed in a solution saturated in N2. When we repeat the experiment in presence of oxygen, the signal differs: the decrease of intensity is faster but the absorbance does not reach zero.
The oxygen generates an interference. To understand what happens, we analyse the signal in presence and in absence of oxygen. If we consider a monomolecular reaction, the decay should have the form of an exponential.
The characteristic time of this process is τ=1/k1. This type of decay is found in presence of oxygen (plus the fact that there is still a signal after the reaction).
If we consider a bimolecular reaction, with the same concentration for both reactants, then the decay is different.
If we pose that k2’=k2/εAb, then
This decay is observed in absence of oxygen as expected for a reaction with two reactants
Note that we talk about equimolar reactants but the quantity of RuTAP and GMP that we put in solution at the beginning of the experiment does not matter. GMP.+ and Ru1+ are equimolar. The absorbance goes thus back to zero.
In presence of oxygen, there is a competition between the oxygen and the GMP.
If the solution is saturated in oxygen (or if the system is open), then [O2]»constant and we find a pseudo order 1. This reaction occurs more than the reaction with GMP.+ because k1[O2]>>k2[GMP.+]. The signal does not go back to zero because some GMP.+ remains in solution (with a long life-time in comparison to the reaction). It is possible to determine the constants of speed k1 and k2 if we place ourselves in good conditions.


